
Though SIGNL4 does not provide canned reports (yet), it allows for downloading all required data of on-call times, alerts and responses. Hence all it takes is an external tool to process and analyze those logs.
Shift and alerts logs can be used to review workload of your team members, frequency of certain alert types, hours spent on duty for compensating your on-call staff, etc. All logs are accessible as CSV files through the SIGNL4 team management portal at ‘Audit Trail’.
Log and Reporting Samples
AlertAuditReport.csv
Timestamp;LogId;EventType;AlertId;EventId;UserId;UserMail;Content;Price;Duration in seconds
2022-05-01T02:34:33.9293685Z;4f7ebe1a-7583-4012-b51b-75e0c3428427;Alert_New;2517509283260706314_c6afef71-a0b6-498f-805b-ada00f015e04;2517509283261971850_86b3d931-4570-478d-b2b0-a4d383cecccc;;;”Heartbeat Missing | Heartbeat missing for 2 hours, 19 seconds.”;0.00;0
2022-05-01T02:48:05.6914856Z;a888e8e7-01c8-419a-aa94-cab52eccd947;Alert_New;2517509275143085143_98296b8b-1d47-4b2f-a848-e4b8c7055874;2517509275144092918_09bbe7e6-097c-4d45-83bb-706f84c2badc;;;[FIRING:1] (Data Alert Value1 g1njkfLMk A) | **Firing** Value: [no value] Labels: – alertname = Data Alert – Key1 = Value1 – datasource_uid = g1njkfLMk – ref_id = A Annotations: Source: https://ronlab.grafana.net/alerting/grafana/OzBXIKbnz/view Silence: https://ronlab.grafana.net/alerting/silence/new?alertmanager=grafana&matcher=Key1%3DValue1&matcher=alertname%3DData+Alert&matcher=datasource_uid%3Dg1njkfLMk&matcher=ref_id%3DA Dashbo…;0.00;0
2022-05-01T03:05:22.4059209Z;a3b924c5-fedf-4bd5-a8e4-a578a7d0c45f;Alert_Closed;2517509283260706314_c6afef71-a0b6-498f-805b-ada00f015e04;2517509283261971850_86b3d931-4570-478d-b2b0-a4d383cecccc;00000000-0000-0000-0000-000000000000;system@signl4.com;;0.00;0
2022-05-01T06:00:58.8668607Z;d85f4729-92a2-4f01-8116-77200fa8fc8b;Alert_New;2517509159411331392_05e834eb-d0e3-458b-85df-a06f35b94746;2517509159413040997_dea243e0-4c8b-484f-bd01-37d118d1fbc2;;;Daily Weather;0.00;0
Attention: The alarm .csv file contains one alarm event per line (not one alert per line). An alarm may therefore consist of several lines, for example, alarm triggered, alarm acknowledged, etc.
ShiftReport.csv
Name;Email;Start;End;Hours
Anna;anna@derdack.com;2018-09-14T15:21:02.0743200Z;2018-09-14T17:31:44.4990010Z;2:10
John;john@derdack.com;2018-09-19T07:51:45.4039920Z;2018-09-19T07:52:29.5466015Z;0:0
John;john@derdack.com;2018-09-19T07:52:58.9672917Z;2018-09-19T08:51:01.8244028Z;0:58
Let look how we can use Microsoft Excel to create some nice reports and charts like these:
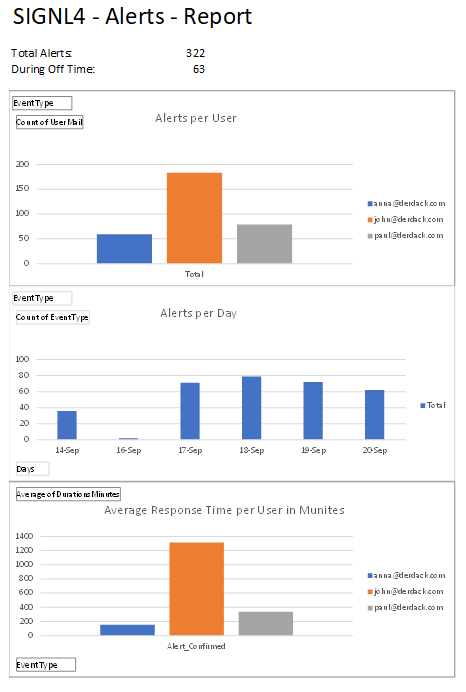
AlertAuditReport
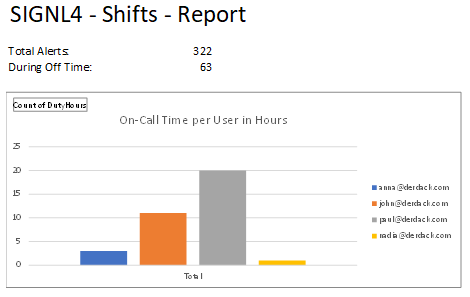
ShiftReport
Follow these steps to get started
1. Download csv log files from your SIGNL4 portal at Audit Trail at https://account.signl4.com/manage/Report
2. Import the .csv files from Excel. Please make sure to import the data and not just open (double-click) it! The import function can automatically recognize the date / time formats used in the SIGNL4 logs (UTC plus timezone).
3. Do the calculations and create the diagrams you need in Excel.
4. Print or export the reports and send them to whoever needs them 🙂
To be honest, creating above charts is a bit tricky. Therefore, we’ve created a sample Excel file for your convenience. You can download it on GitHub: https://github.com/signl4/signl4-reporting.
This Excel file provides the following reporting information:
Alerts
- Total number of alerts
- Alerts outside working hours
- Number of alerts per user
- Number of alerts per day
- Average response times per user
Shifts
- Total number of alerts
- Alerts outside working hours
- On-call time per user in hours
With this Excel file you can add your CSV date in the following way:
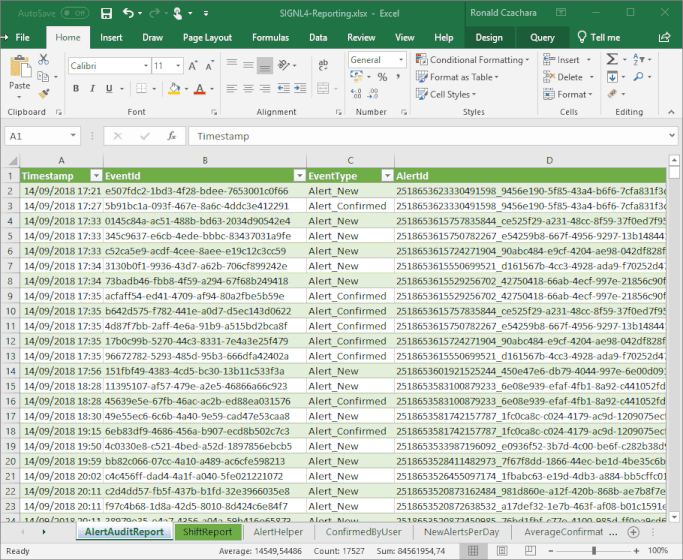
1. Open the file SIGNL4-Reporting.xls and point to your .csv files. In order to do so go to Data -> Queries & Connections and then double-click AlertAuditReport on the right-hand side. The Power Query Editor opens. Here go to Home -> Advanced Editor. In the text box you can see the path to the .csv file. Adapt this one to match the path to your AlertAuditReport .csv file. Then click Done and Save & Load to close the Power Query Editor. Do the same for SiftReport as well.
2. Back in the main Excel window click Data -> Refresh All. This will update the report accordingly.
3. You might want to adapt the reports with the information you need. If you have large data sets you can also add additional rows by copy and paste in the Sheets AlertHelper and ShiftHelper.
4. That is it and your reports are available in the Sheets Alerts and Shifts. You can print them or export them as PDF.
(Click to open animated GIF.)
If you have any questions you can mail me at ron@signl4.com


