
Mobile alerting with tracking & escalation for Elasticsearch / Kibana

![]() Why SIGNL4
Why SIGNL4
When critical systems fail, SIGNL4 is the fastest way to alert your staff, engineers, IT admins on call and “in the field”. SIGNL4 provides reliable notifications via mobile app push, text and voice calls with tracking, escalations and duty scheduling.
Kibana is an open source data visualization dashboard for Elasticsearch. It provides allows users to create bar, line and scatter plots, or pie charts and maps for of large volumes of data. You can do anything from tracking query load to understanding the way requests flow through your apps.
Pairing Kibana with SIGNL4 can enhance your daily operations with an extension to your team wherever it is. The integration does not only allow you to know when a critical issue has occurred but also when it was resolved no matter where you are.
![]() How it Works
How it Works
Kibana compatibility allows you to distribute operational alerts to a mobile SIGNL4 team by using a simple webhook. Persistent notifications and acknowledgement requirements ensure that issues will be handled before it is too late.
![]() Integration Capabilities
Integration Capabilities
- IT staff is alerted via mobile push, SMS text and voice call
- Staff can acknowledge and take ownership for critical events that occur
- Alerts are escalated in case of no response
- Communicate within an alert to address a particular problem
- Inbound webhook (HTTP) connection from Kibana to SIGNL4
- On-call scheduling to alert the right people at the right time
![]() Scenarios
Scenarios
- IoT
- Big data
- Production monitoring
- System Monitoring
- Application Monitoring
- Network Monitoring
- Database Monitoring
Tickets and Incidents are sent to SIGNL4
Event categorization, routing and automated delivery
Persistent Notifications by push, text and voice call with Tracking, Escalation and Confirmation to Staff on Duty
HOW TO INTEGRATE
The integration of Kibana and SIGNL4 is done using a webhook. In our example we monitor a temperature. If the temperature is too high we generate an alert and send it to our SIGNL4-Team.
Prerequisites
A SIGNL4 account (https://www.signl4.com)
Kibana (https://www.elastic.co/kibana)
A data source (in our case we use Kaa IoT: https://www.kaaproject.org)

In our example we use the IoT platform Kaa IoT with a connected device to get temperature data into Kabana. You can find more information at https://www.kaaproject.org.

In your Kabana portal you go to Alerts and Actions and then to Connectors. Here you create a new Webhook connector. The POST URL is your SIGNL4 webhook URL including your team secret. You can also add the header “Content-Type”: “application/json”.
You can now Save & Test and as body enter some test data:
{
"Title": "Kibana Alert",
"Message": "Test",
}
Now go to Alerts in order to create a new Alert. Here you can specify the threshold and the condition and select the SIGNL4 alert connector you have created above. As body you enter the data in JSON format according to your needs. You can also add alert variables here. The following shows an example.
{
"Title": "{{context.title}}",
"Message": "{{context.message}}",
"Value": "{{context.value}}",
"AlertId": "{{alertId}}"
}
That is it and now you can test the alert. You can for example simulate higher temperature and you should then receive an alert in your SIGNL4 app.
ALERT OPTIMIZATION
SIGNL4 can further increase the visibility of alerts through its Signals and Services section. Augmenting the color and icon of alerts will provide more relevant information at a glance without having to open the alert.
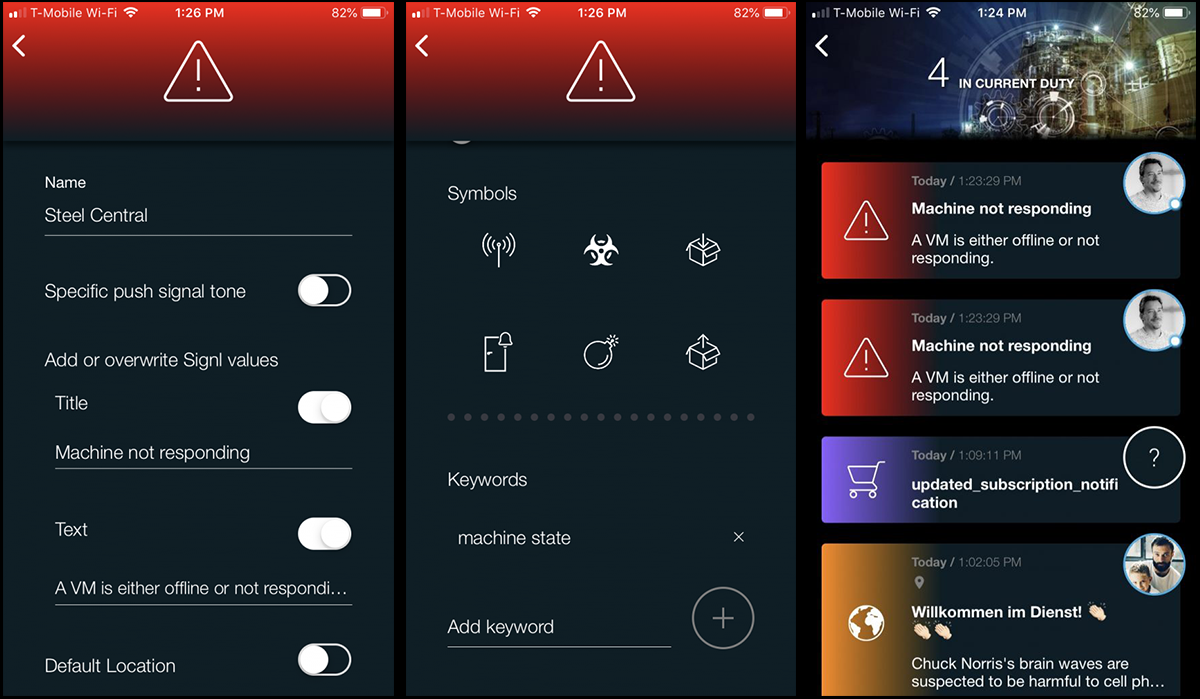
Change alert color and override title + text
Override text, colors and titles are triggered by keywords set within the mobile app.